Gráficos en Hive ? Video tutorial / Graphs and Tables for your Hive Publications
12
About :
Como crear una tabla dinámica y grafico para posteriormente insertarlo en una publicaciones en Hive.
Nuevamente es un placer saludarles, esta vez con un video tutorial de la reconocida herramienta de Microsoft Excel donde estaremos creando una tabla dinámica y grafico para posteriormente insertarlo en una de nuestras publicaciones en Hive.
Mi nombre es Leo Lara y para mi es un placer poder llevar esta información a través de este video tutorial que está realizado con mucho cariño para todos mis queridos amigos de Hive y 3speak.
Nos vemos en otra oportunidad.
Mis redes sociales:
Twitter @ leosanchez3

Mi nombre es Leo Lara y para mi es un placer poder llevar esta información a través de este video tutorial que está realizado con mucho cariño para todos mis queridos amigos de Hive y 3speak.
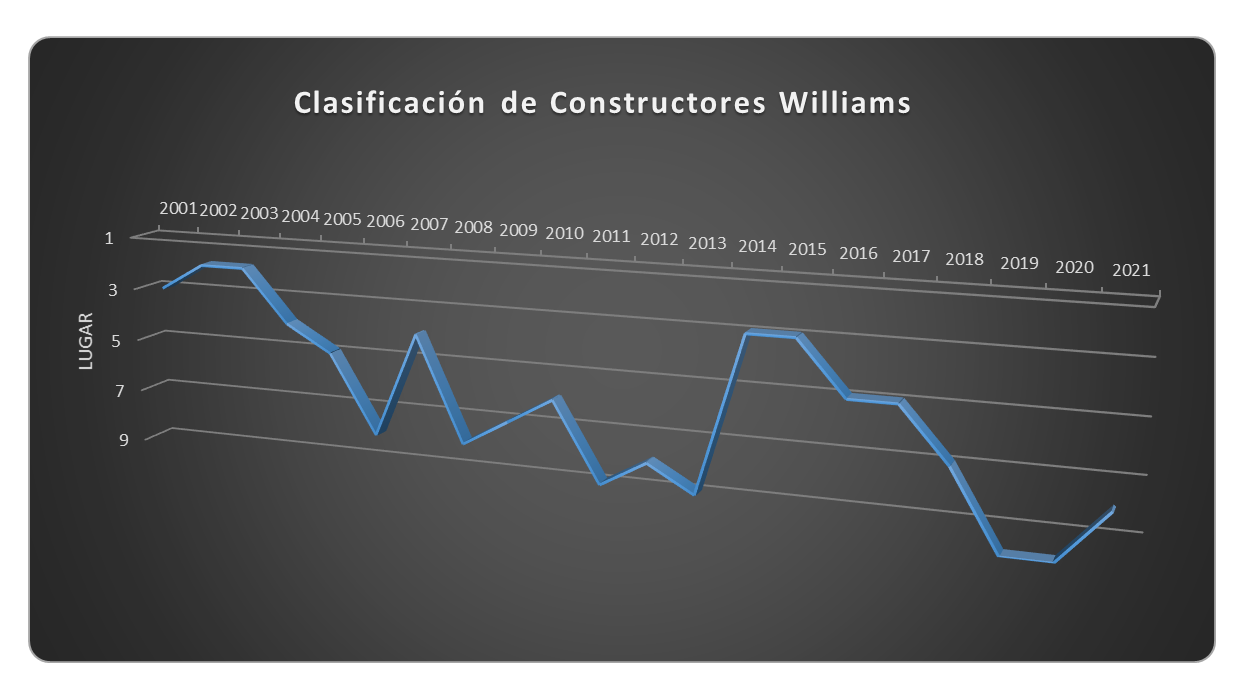
En una reciente publicación para la comunidad de @fulldeportes acerca de Formula 1 Equipos , Calendario 2022 hice uso de un recurso el cual no había utilizado para enriquecer mis publicaciones en Hive, es por eso que hoy les hablaré de lo útil y efectivo que resulta el uso de las tablas dinámicas y gráficos para compartir datos estadísticas e información en nuestras redes sociales
Las tablas dinámicas nos proporcionan una manera muy efectiva de presentar nuestros gráficos los cuales llevan información resumida y muy efectiva. Facialmente podemos incluir esta herramienta a nuestras publicaciones y de esta forma enriquecer además de darle mayor belleza y elegancia a todos nuestros temas así como para compartir importantes datos en nuestras redes sociales.
Aplicaciones de los gráficos en Internet solo por nombrar algunos:
- Deporte
- Política
- Finanzas
- Administración
- Estadísticas
Ejemplos útiles:
Espero que pronto puedan dominar esta útil herramienta, si deseas puedes escribir cualquier pregunta o sugerencia en los comentarios de la publicación, con gusto estaré respondiéndolas.
Nos vemos en otra oportunidad.
Again it is a pleasure to greet you, this time with a video tutorial of the renowned Microsoft Excel tool where we will be creating a pivot table and graph for later inserting it into one of our publications in Hive.
I'm Leo Lara and for me it is a pleasure to bring this information through this video tutorial that is made with love for all my dear friends of Hive and 3speak.
In a recent publication for the community of @fulldeportes about Formula 1 Teams, Calendar 2022 I made use of a resource which I had not used to enrich my publications in Hive, that's why today I will talk about how useful and effective is the use of pivot tables and graphs to share statistical data and information in our social networks.
Pivot tables provide us with a very effective way to present our graphs which carry summarized and very effective information. We can facially include this tool to our publications and thus enrich and give more beauty and elegance to all our topics as well as to share important data in our social networks.
Applications of graphics on the Internet just to name a few:
- Sports
- Politics
- Finance
- Administration
- Statistics
I hope you will soon be able to master this useful tool, if you wish you can write any questions or suggestions in the comments of the publication, I will be glad to answer them.
See you another time.
Translated with www.DeepL.com/Translator (free version)
Créditos / sources:
Logos propiedad de threespeak, / hive
¡Gracias por ver el video!

Mis redes sociales:
Twitter @ leosanchez3
Telegram @ leosanchez3
Audio de fondo música de:
ItsWatR de Pixabay
Alex_MakeMusic de Pixabay
Camera Used: Smartphone
Model: Moto G3 Plus
Resolución: HD 720p@30fps
Software Editing: Filmora Wondershare Copyright © 2021 Wondershare. All rights reserved.
*Diseño realizado en Programa de manipulación de imágenes de GNU /GIMP Copyright © 1995-2021
Microsoft Excel © 2016 - 2022 es una marca registrada propiedad de Microsoft Corporation ©. Todos los derechos reservados la cual es mencionada solo con fines educativos.
Show more
Tags :
Woo!
This creator can upvote comments using 3speak's stake today because they are a top performing creator!
Leave a quality comment relating to their content and you could receive an upvote
worth at least a dollar.
Their limit for today is $0!
Their limit for today is $0!

12 views
5 months ago
$

17 views
2 years ago
$

9 views
3 years ago
$

8 views
5 months ago
$

13 views
3 years ago
$
More Videos

4 views
3 years ago
$

3 views
4 years ago
$

4 views
5 years ago
$

23 views
3 years ago
$

2 views
3 years ago
$

6 views
2 years ago
$

25 views
2 years ago
$

9 views
4 years ago
$

9 views
4 years ago
$

0 views
3 years ago
$

3 views
2 years ago
$

67 views
5 years ago
$

2 views
2 years ago
$

0 views
2 years ago
$

13 views
a year ago
$

6 views
a year ago
$

16 views
2 years ago
$

32 views
a year ago
$

1 views
4 years ago
$

0 views
9 months ago
$

130 views
2 years ago
$

28 views
a year ago
$
@threespeak: 7.9255
@iliyan90: 0.1642
@marcocasario: 0.0897
@ississ89: 0.0373
@smartvote: 0.0277
@omarrojas: 0.0250
@omarcitorojas: 0.0191
@threespeak-es: 0.0168
@ilazramusic: 0.0163
@iliyan90: 0.1642
@marcocasario: 0.0897
@ississ89: 0.0373
@smartvote: 0.0277
@omarrojas: 0.0250
@omarcitorojas: 0.0191
@threespeak-es: 0.0168
@ilazramusic: 0.0163
Comments:
Reply:
To comment on this video please connect a HIVE account to your profile: Connect HIVE Account