Finally...Litecoin Is Making Headlines Again
4
About :
The founder of Litecoin, Charlie Lee is one of the greatest crypto traders out there. I mean he sold all his Litecoin at the top of the 2017 crypto bubble. If that’s not timing, I don’t know what is timing. Charlie Lee said he was accused of talking about the price of the Litecoin on Twitter for “personal benefit,” so he sold his holdings to eliminate any conflict of interests. Great excuse, but when prices rose over 7000%, I think Charlie knew that Litecoin was overinflated when he sold.
In true Charlie Lee fashion, yesterday Charlie tweeted a cryptic emoji message of a chicken, dolphin, bee, cash and soon arrow. In this video, I talk about what the emoji means and how much higher can Litecoin move.
https://finance.yahoo.com/news/litecoin-surges-paypal-includes-among-154551780.html
MY TRADING METHODOLOGY IN A NUTSHELL BELOW
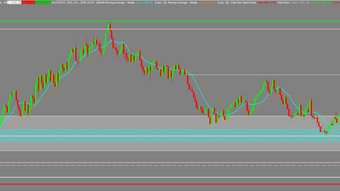
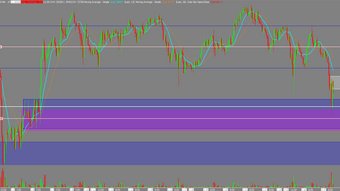
I’m a supply and demand trader. The premise of supply and demand trading is when the market makes a sharp move up or down the large institutions i.e banks/hedge funds are not able to get their entire trade placed into the market, leaving pending orders to buy or sell at the zone with the expectation the market will return to the zone and the rest of their trading position will be filled.
I use multiple time frame (MTF) analysis to improve my discretionary trading decisions. MTF analysis involves analyzing the same asset on multiple time frames. The rule of thumb when using MFT is you want your charts to scale down/up by 4X – 6X. In my case I tend to look at:
Monthly Charts (curve time frame) – which represents that jet fighter flying over the football stadium.
Weekly Charts (trend time frame) – which represents the concession stands looking down at the field.
Daily Charts (entry time frame) – which represents being on the football field with the player.
4 Hr Charts (entry time frame) – which represents the center hiking the ball to the quarterback.
Show more
Tags :
Woo!
This creator can upvote comments using 3speak's stake today because they are a top performing creator!
Leave a quality comment relating to their content and you could receive an upvote
worth at least a dollar.
Their limit for today is $0!
Their limit for today is $0!

5 views
4 years ago
$

6 views
4 years ago
$
1 views
4 years ago
$

6 views
4 years ago
$
6 views
4 years ago
$
More Videos

36 views
3 years ago
$

4 views
3 years ago
$

26 views
3 years ago
$

9 views
4 years ago
$

34 views
5 years ago
$

9 views
11 months ago
$

5 views
3 years ago
$

11 views
a year ago
$

8 views
5 years ago
$

13 views
4 years ago
$

47 views
4 years ago
$

7 views
a year ago
$

5 views
10 months ago
$

4 views
3 years ago
$

26 views
2 years ago
$

4 views
2 years ago
$

0 views
5 years ago
$

14 views
a year ago
$

285 views
6 years ago
$

0 views
4 years ago
$

Breaking Down Venus Drops 98% Now After Breaking Out It Will Surge 5000% | XVS Price Prediction 2022
0 views
3 years ago
$

27 views
a year ago
$

3 views
a year ago
$
@leo.voter: 0.3675
@adsactly: 0.1077
@enginewitty: 0.0385
@organduo: 0.0242
@preparedwombat: 0.0229
@edkarnie: 0.0215
@diverse: 0.0208
@sagesigma: 0.0196
@rollandthomas: 0.0189
@adsactly: 0.1077
@enginewitty: 0.0385
@organduo: 0.0242
@preparedwombat: 0.0229
@edkarnie: 0.0215
@diverse: 0.0208
@sagesigma: 0.0196
@rollandthomas: 0.0189
Comments:
Reply:
To comment on this video please connect a HIVE account to your profile: Connect HIVE Account