Cost Benefit Analysis Contest Results
1
About :
Hi Everyone,
Welcome to the Cost Benefit Analysis (CBA) Contest results post. This is the third economics contest for 2023. This post contains a video of an Excel Model. This Excel Model determines the winner of the contest by generating costs and benefits for investment decisions made by the participants.
Winner determined in this video
What is the CBA Contest?
The CBA Contest is an investment challenge, which assesses the investment decisions of participants using CBA methodology. Participants are given the responsibility for providing investment advice for four towns and cities. They can recommend investment in education, healthcare, transport, and/or entertainment. Investment options relate to increasing capacity. Capacity of existing infrastructure and amenities can be increased by 5%, 10%, 20% or 50%. Participants are given $12 Billion to spend on investment decisions but are not compelled to spend all of it. The objective of the contest is to obtain the highest Net Present Value (NPV). This is determined by subtracting discounted net costs from discounted net benefits.
Responses to the contest are made in the comments section of the contest post. The account with the winning entry will receive 30 Hive Power.
The format of the required entry is explained in detail in the contest itself.
For a more detailed explanation, you can access the contest post using the following link.
Results of the CBA Contest
Table 1 contains the growth rates generated by the Excel Model for adults, children, elderly and tourists for the four towns and cities.
Table 1: Population Growth Rates
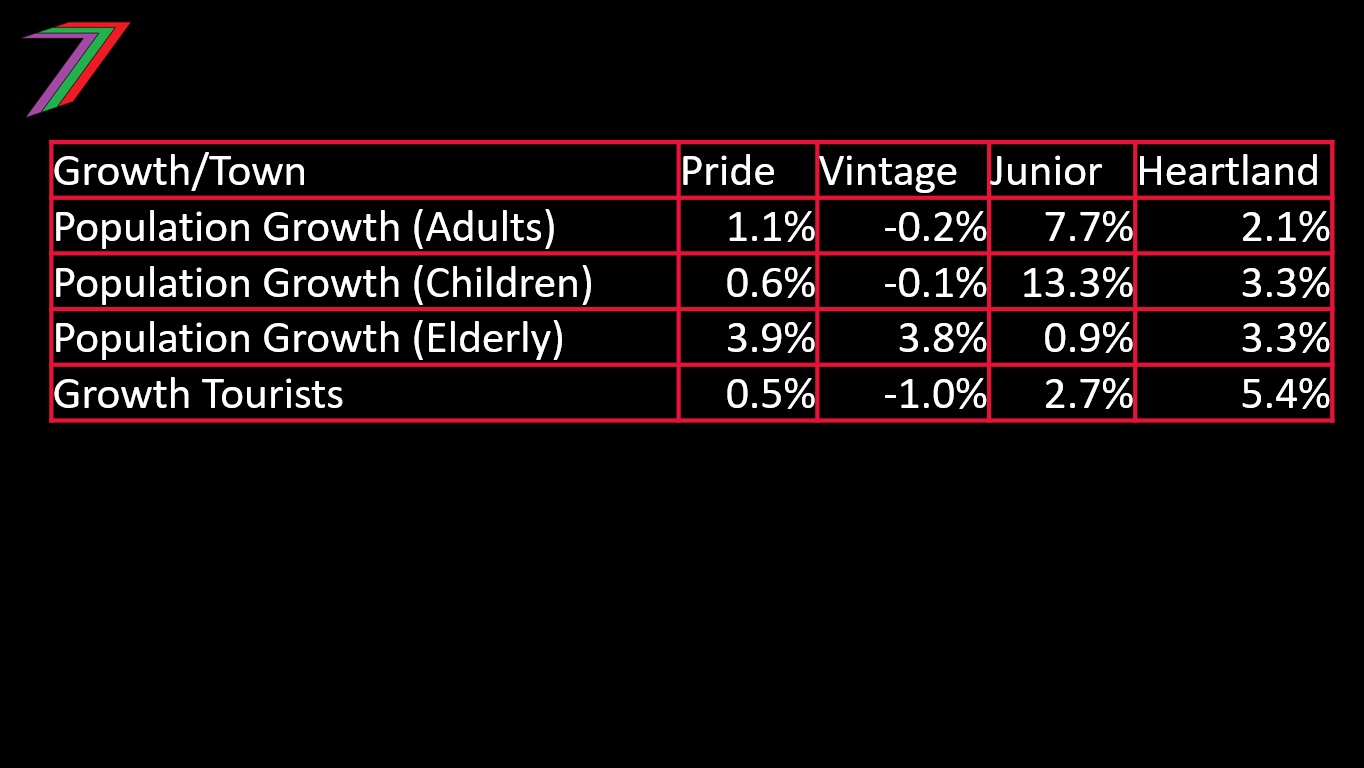
Table 2 contains the investment decisions made by the nine participants who entered this contest.
Table 2: Participants Investment Decisions
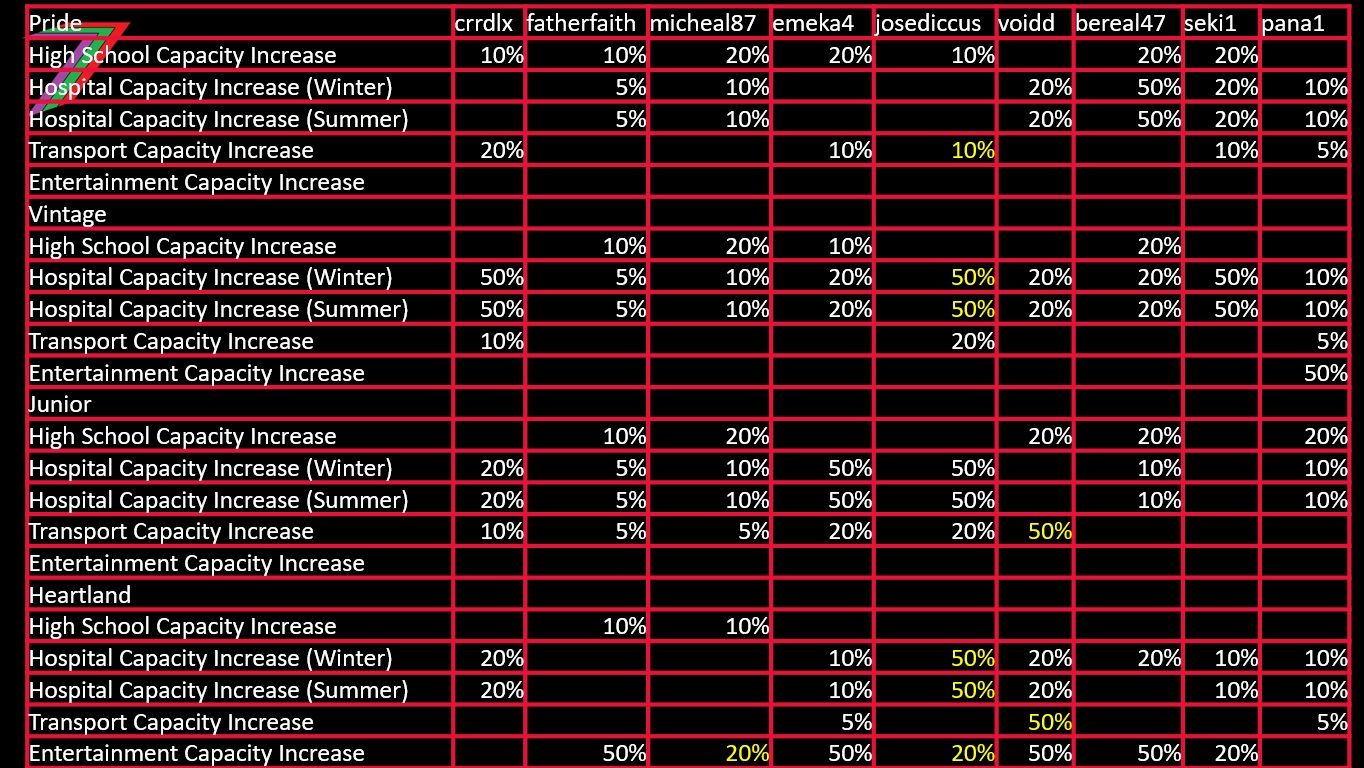
Note: Yellow numbers represent numbers that have been changed because they did not align with the percentage increases required by the question (5%, 10%, 20%, or 50%). Some have been rounded up and some rounded down.
Table 3 contains the benefits, costs, and NPV of the investment decisions made by each participant.
Table 3: Benefits, Costs, and NPV of Investment Decisions
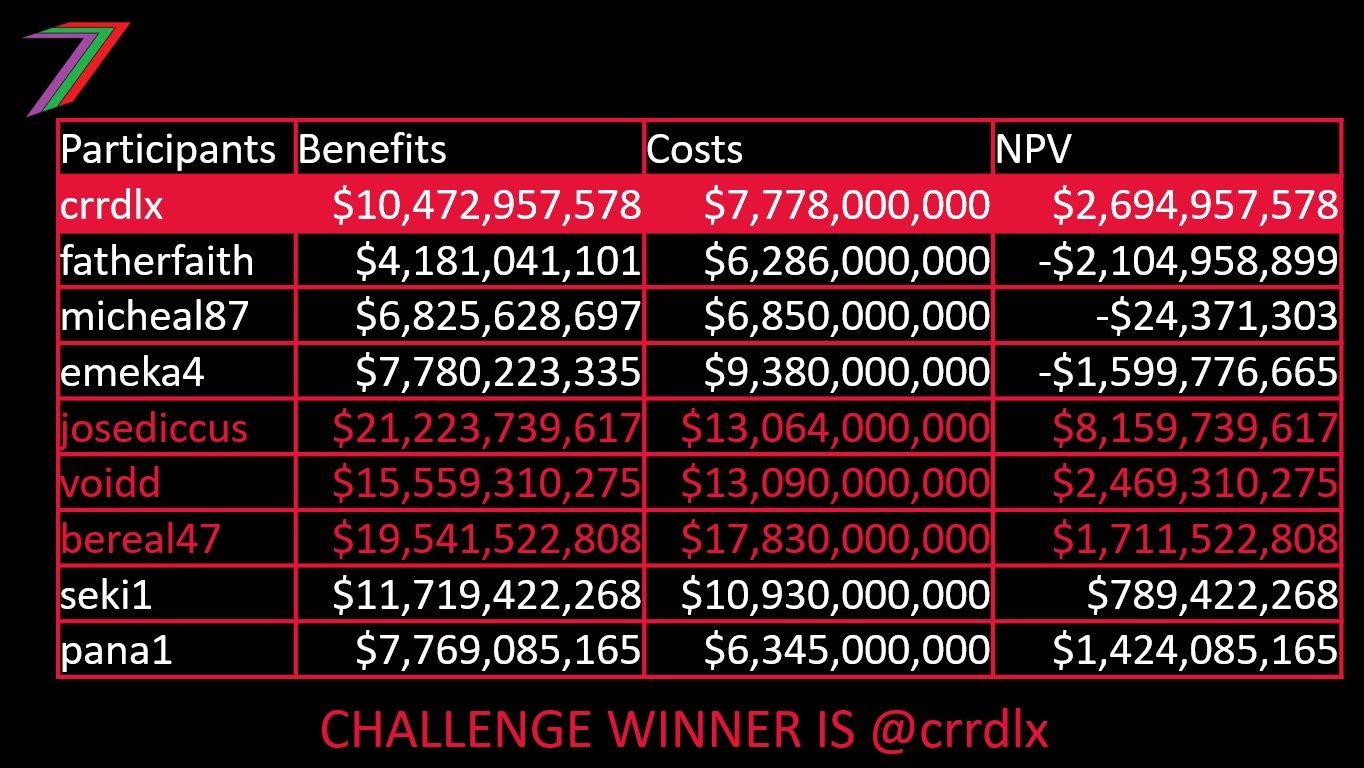
Note: participants in red exceeded the $12 Billion budget.
The winner of the CBA Contest by obtaining the highest NPV is @crrdlx. @crrdlx achieved an NPV of $2,694,957,578. @crrdlx focused on increasing hospital and transport capacity in the towns and cities. @crrdlx wins 30 Hive Power
Contest Tips
The aim of this contest was to achieve the highest possible Net Present Value (NPV). In order to achieve a high NPV, benefits need to greatly exceed investment costs.
For this CBA, benefits are equivalent to user cost reductions. Insufficient healthcare, education, transport, and entertainment were assumed as user costs; reducing these user costs is a benefit of investment. If a user cost is high in the base case (in the absences of the upgrade) and is low in the project case (with the upgrade), the benefit from the upgrade is high. This requires two conditions. The first condition is that the costs are high in the base case. For example, hospital capacity is far exceeded and many people will be dying if capacity is not increased. The second condition is that the upgrade significantly reduces the user cost. For example, the upgrade in hospital capacity is sufficient to handle the number of patients and the number of unnecessary deaths are greatly reduced.
How do we know that the costs in the base case are going to be high? We should consider three things. The population growth rates, current usage and occupancy rates, and the costs of exceeding capacity. If all three are high, user costs will be high. Evaluation period (e.g. asset life) was also a factor to consider in this CBA. The evaluation period was long (20 years). This meant that growth rates played a bigger role in determining the user costs. The discount rate (4%) reduced this impact a little. Population growth rates were unknown to the participants but they were provided with a range. Participants should have considered the expected value for growth rates and the areas they are likely to impact the most.
Capacity upgrades have varying effects on benefits. Larger capacity upgrades are needed to respond to user costs caused by high growth rates. Smaller capacity upgrades could be good for handling user costs caused by high costs of overcapacity when growth rates are close to zero. The question did not offer any clear opportunities for this approach to investment.
Figure 1 contains the total user costs for the towns and cities, capacity upgrades that could lower some of these user costs, the investment costs required for these upgrades, and possible prioritising of investment.
Figure 1: Possible Investment Approach (Good return on investment)
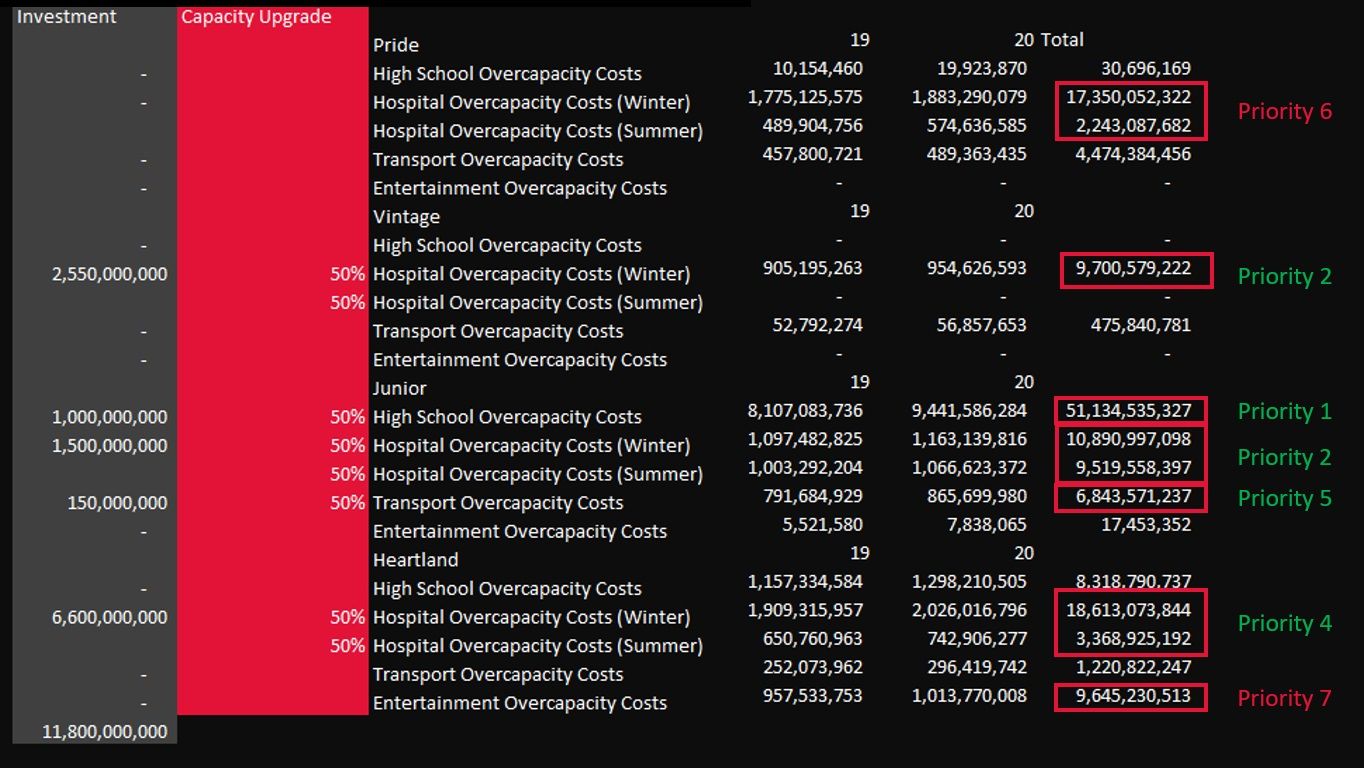
Note: Priorities in green were selected for investment. Priorities in red were not selected because of insufficient funding.
All investment costs are provided in the question and there are no maintenance or operational costs to be concerned about. The cost of investment in cities was much higher as the percentage increases to capacity would be far more extensive (e.g. increasing 100 by 10% is only 10 but increasing 1,000 by 10% is 100). Investing in towns enables us to do more with less money.
In Figure 2, I compare the participant’s NPV with the NPV using the example shown in Figure 1. I recalculated four times to obtain a range of possible results; there is some benefit of hindsight that participants did not have.
Figure 2: Participants NPV vs. Example
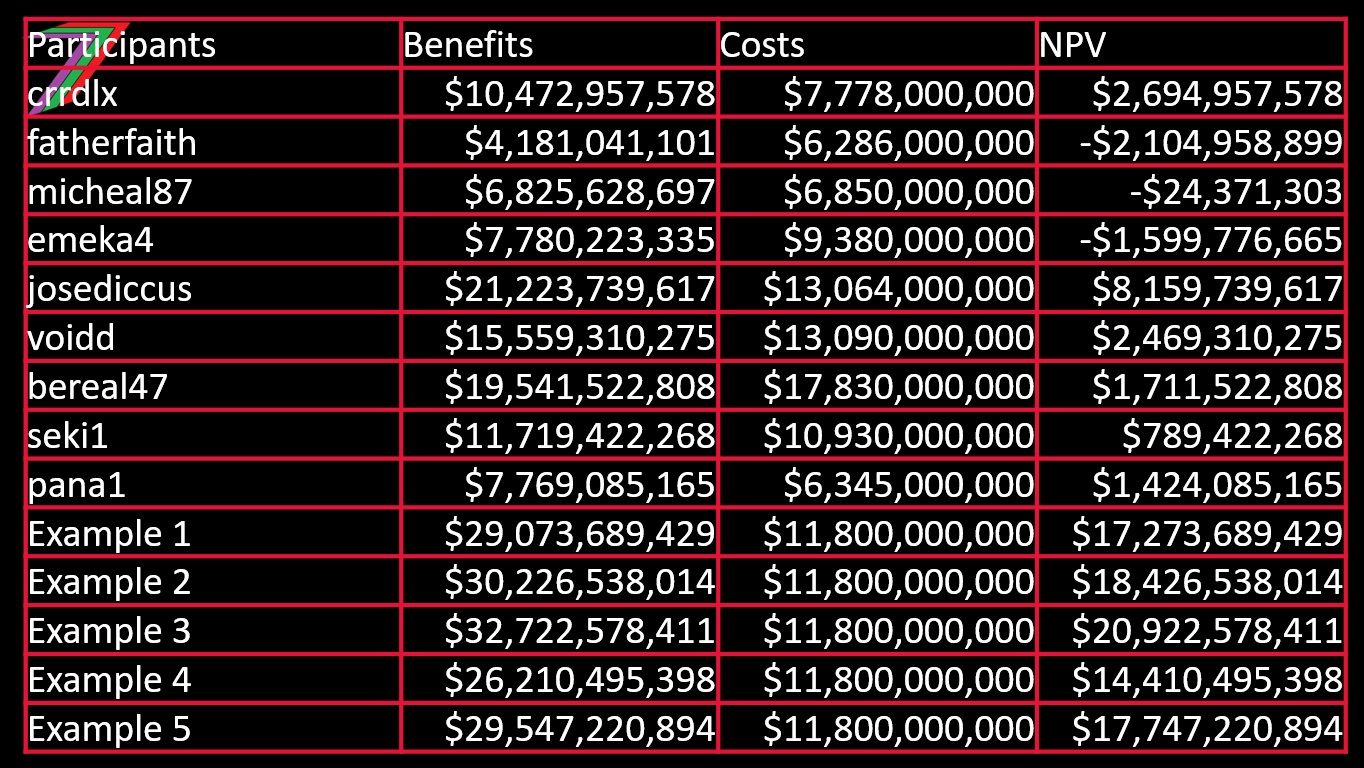
Note: Not included in video, will show next time when I run this contest.
I would like to thank the following participants for attempting this challenging contest:
This is most likely to be the most complicated contest for this year. The CBA Contest is likely to return in some form in 2024. Another contest will be posted later this month.
More posts

If you want to read any of my other posts, you can click on the links below. These links will lead you to posts containing my collection of works. These 'Collection of Works' posts have been updated to contain links to the Hive versions of my posts.


Hive: Future of Social Media

Spectrumecons on the Hive blockchain

Show more
Tags :
Woo!
This creator can upvote comments using 3speak's stake today because they are a top performing creator!
Leave a quality comment relating to their content and you could receive an upvote
worth at least a dollar.
Their limit for today is $0!
Their limit for today is $0!

3 views
2 years ago
$

1 views
2 years ago
$
3 views
2 years ago
$

9 views
4 years ago
$

5 views
a year ago
$
More Videos

14 views
a year ago
$

6 views
a year ago
$

12 views
2 years ago
$

15 views
2 years ago
$

2 views
6 months ago
$
2 views
10 months ago
$

4 views
a year ago
$

18 views
2 years ago
$

3 views
a year ago
$

6 views
3 years ago
$

1 views
2 years ago
$

6 views
10 months ago
$

15 views
9 months ago
$

7 views
9 months ago
$

7 views
a year ago
$

3 views
2 years ago
$

5 views
8 months ago
$

2 views
2 years ago
$

0 views
2 years ago
$

13 views
3 years ago
$

0 views
2 weeks ago
$

10 views
a year ago
$

23 views
a year ago
$

7 views
2 years ago
$
Comments:
Reply:
To comment on this video please connect a HIVE account to your profile: Connect HIVE Account