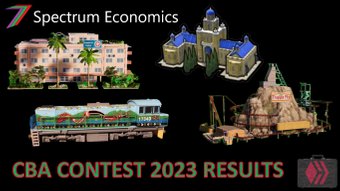
Spectrumecons 7 Week Challenge – Challenge 3: Cost Benefit Analysis Results
5
About :
Hi Everyone,
Welcome to the results post for Challenge 3: Cost Benefit Analysis (CBA). This post contains a video of an Excel Model, which generates the growth rates for each town, and the costs and benefits for each participants’ investment decisions.
Winner determined in this video
What is the CBA Challenge?
The CBA Challenge is an investment challenge, which assesses the investment decisions of participants using CBA methodology. Participants are given four towns where they can choose to investment in education, healthcare, transport, and/or entertainment. Investment options relate to increasing capacity. Capacity of existing infrastructure and amenities can be increased by 5%, 10%, 20% or 50%. Participants are given $10 Billion to spend on investment decisions but are not compelled to spend all of it. The objective of the challenge is to obtain the highest Net Present Value (NPV).
Responses to the challenge are made in the comments section of the challenge post. The account with the winning entry will receive Hive equivalent to 5 times the number of participants (e.g. if challenge has 6 participants the prize will be 30 Hive (5 × 6)). The maximum prize for this challenge is 60 Hive. In addition to the winning prize, the first 12 entries are given upvotes. In addition to the prize in Hive, the winner receives 40 points, second place 10 points, and third place 5 points; these points contribute to determining the overall challenge series winner.
The format of the required entry is explained in detail in the challenge itself.
For a more detailed explanation, you can access the challenge post using the following link.
Other challenges
There are six other challenges in the series. Below are five of them.
- Challenge 1: Buying and Selling Game
- Challenge 2: Game Theory
- Challenge 4: Make Me Happy
- Challenge 5: Auction
- Challenge 6: Buying and Selling Game (Business Version)
Results of Challenge 3
Table 1 contains the growth rates generated by the Excel Model for adults, children, elderly and tourists for the four towns.
Table 1: Population Growth Rates
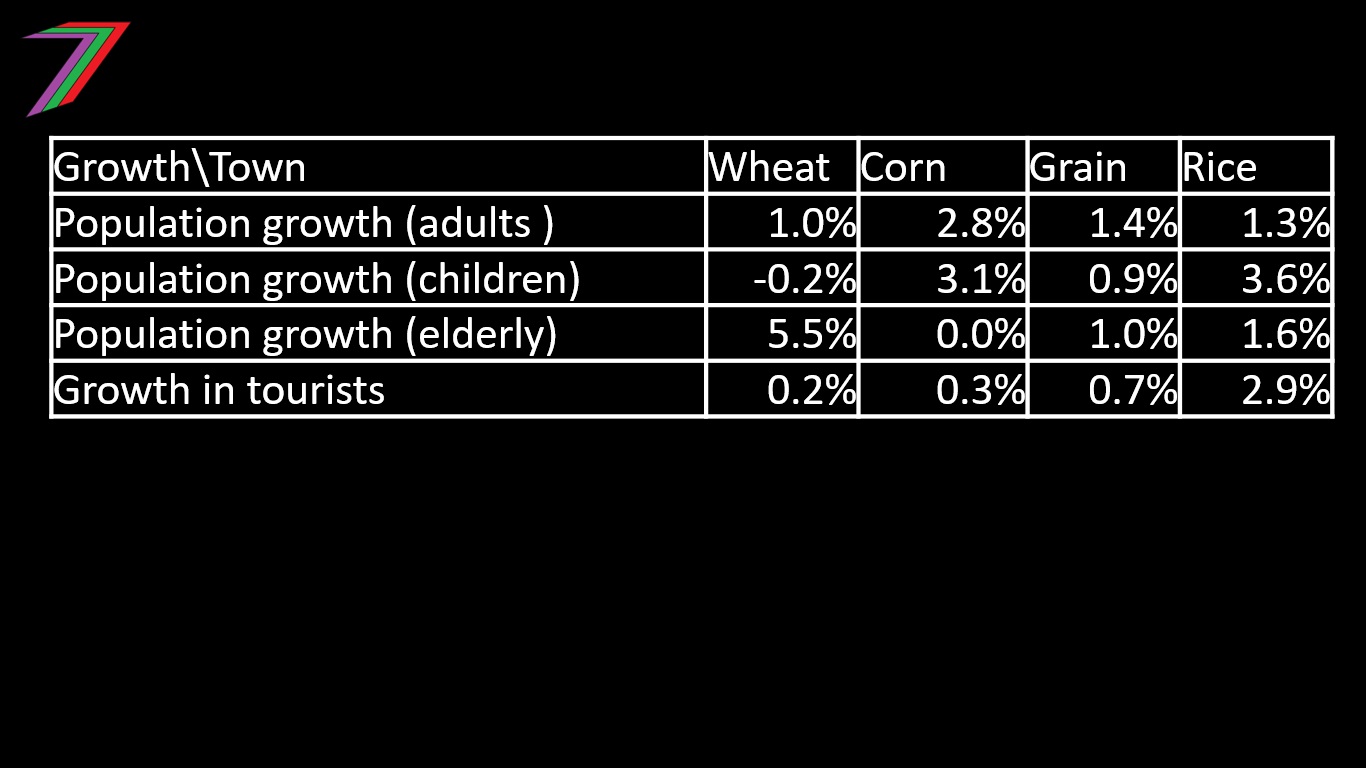
Table 2 contains the investment decisions made by the four participants who entered this challenge.
Table 2: Participants Investment Decisions
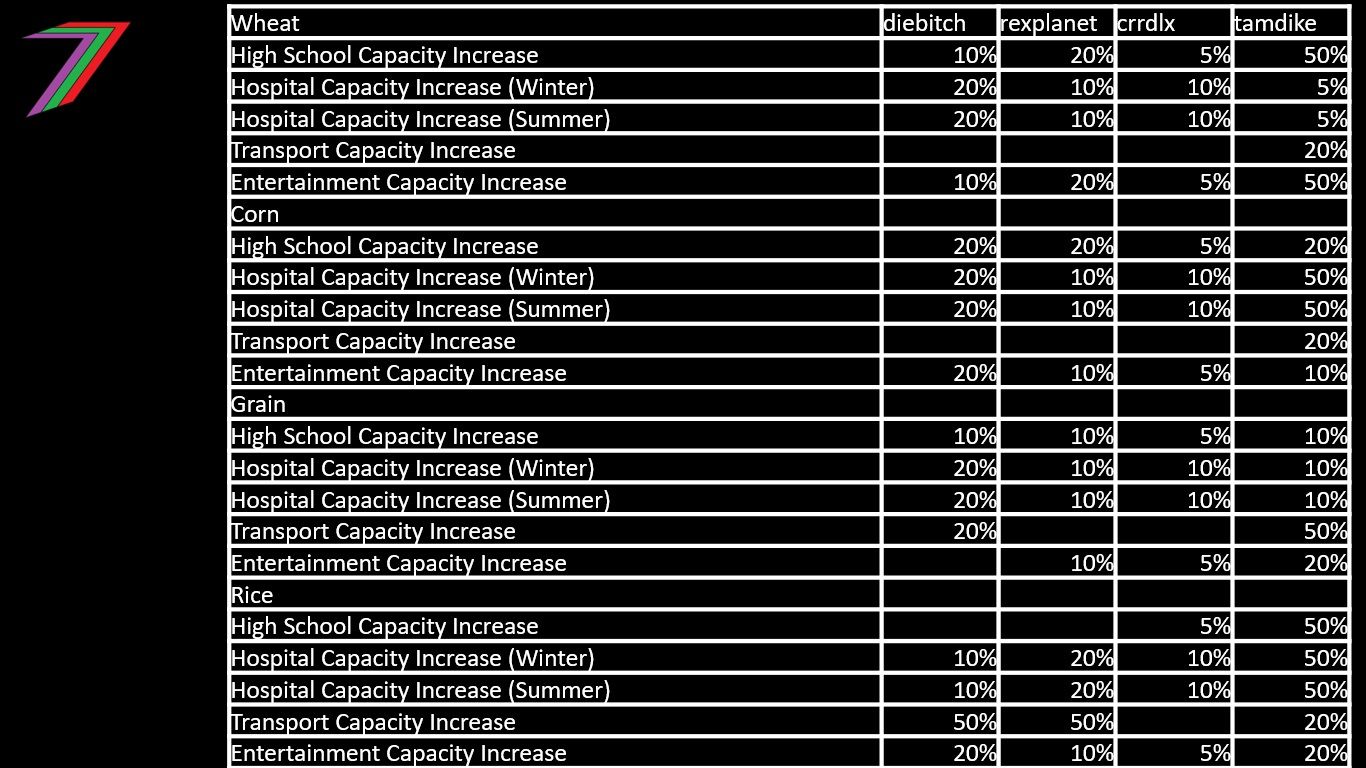
Table 3 contains the benefits, costs, and NPV of the investment decisions made by each participant.
Table 3: Benefits, Costs, and NPV of Investment Decisions
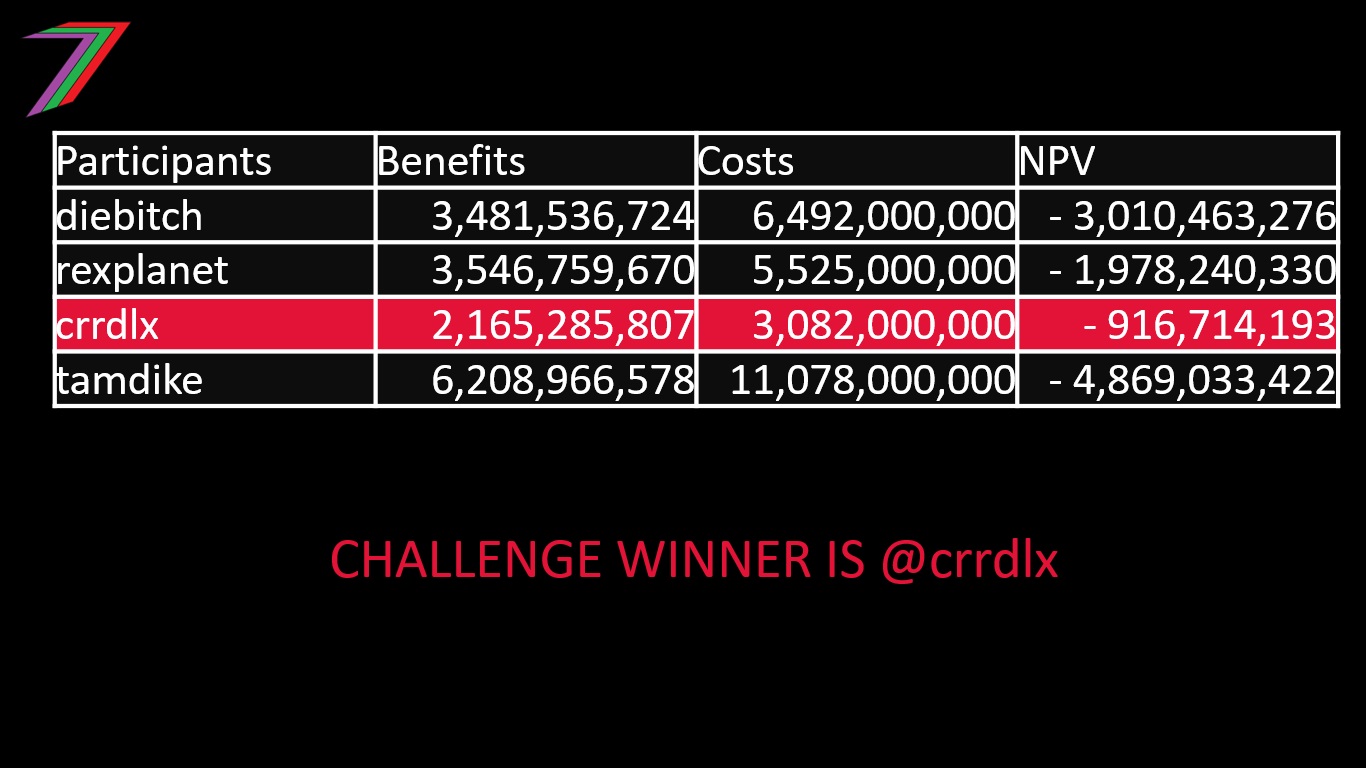
The winner of Challenge 3 with the highest NPV is @crrdlx. @crrdlx achieved an NPV of -$916,714,193. @crrdlx wins 20 Hive (5 × 4) and is awarded 40 points. @rexplanet is award 10 points for second place and @diebitch is awarded 5 points for third place.
Below are the challenge series overall scores, so far.
Overall Series Score
| Participants | Points |
|---|---|
| Crrdlx | 40 |
| Shubhwaj | 30 |
| Diebitch | 25 |
| Tamdike | 10 |
| Rexplanet | 10 |
| Failingforwards | 5 |
Challenge Tips
The aim of this challenge was to achieve the highest NPV as possible. In order to achieve a high NPV, the areas for the highest potential benefit should be targeted. In the case for this challenge, the areas with the highest potential user cost in the base case would have the highest potential benefit. User costs are directly linked to growth rates, existing capacity, and costs of exceeding capacity. For a user cost to exist, growth rates would need to push the demand above capacity. The sooner this occurs, the higher the user costs, as there are more years where capacity has been exceeded. However, if the costs of exceeding capacity are low, user costs should not be expected to be high.
The costs of exceeding capacity for hospitals is considerably higher than the costs of exceeding capacity for any of the other facilities and infrastructure. The next area to consider is investment cost. Is a large investment cost required to reduce user costs? Costs of upgrading hospitals in Grain are high compared to other towns and Grain is only at 92% capacity when other towns such as Corn and Rice are at 98% and 95% capacity respectively. Therefore, a sensible strategy would be to provide Grain with a smaller upgrade of 10%, Rice with a larger upgrade of 20% and Corn with an upgrade of 20% or 50%. Figure 1 contains the user costs in the base case.
Figure 1: Base Case User Costs
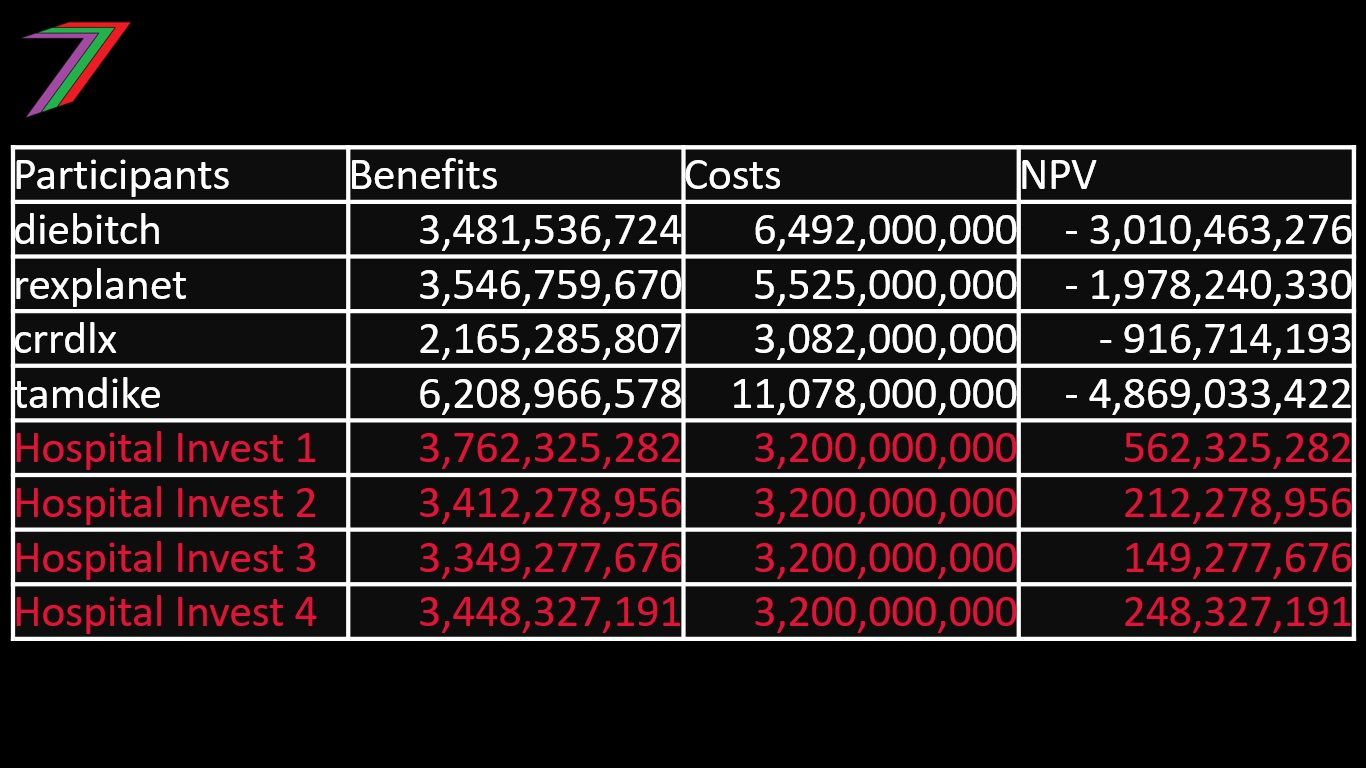
I ran 4 simulations using a strategy of just investing in hospitals. Grain was upgraded by 10%, Rice was upgrade by 20% and Corn was upgraded by 50%. Each simulation generated a small but positive NPV. See Table 4.
Table 4: Challenge Results and Four simulations with Hospital Focus
After considering upgrading hospitals, the next areas should be other areas that are at or very close to capacity. For example, entertainment is at 100% capacity in Wheat. A small upgrade of 5% or 10% would most likely add to the NPV. Areas that are above 95% capacity and have a high probability of positive growth are likely to increase NPV. For example, small investments in High Schools in Wheat or Transport in Grain will probably produce positive NPVs.
Investing in an area with the potential for very high growth might be tempting but if there is plenty of excess capacity, the returns will come much later and possibly not at all, if the very high growth is not realised. For example in Rice, High Schools were at 80% capacity but the growth rate for children was 3.6%. Therefore, maximum capacity was reached quite quickly. However, growth could have been as low as 1%, which would have produced a negative NPV. Therefore, investing in upgrading the High Schools in Rice would have been risky but also potentially very rewarding.
More posts

If you want to read any of my other posts, you can click on the links below. These links will lead you to posts containing my collection of works. These 'Collection of Works' posts have been updated to contain links to the Hive versions of my posts.

My CBA Udemy Course

The course contains over 10 hours of video, over 60 downloadable resources, over 40 multiple-choice questions, 2 sample case studies, 1 practice CBA, life time access and a certificate on completion. The course is priced at the Tier 1 price of £20. I believe it is frequently available at half-price.
Future of Social Media

Show more
Tags :
Woo!
This creator can upvote comments using 3speak's stake today because they are a top performing creator!
Leave a quality comment relating to their content and you could receive an upvote
worth at least a dollar.
Their limit for today is $0!
Their limit for today is $0!
1 views
a year ago
$

7 views
a year ago
$

14 views
4 years ago
$

5 views
a year ago
$

6 views
a year ago
$
More Videos

17 views
3 years ago
$

19 views
2 years ago
$

36 views
a year ago
$

"The Making" Of Porridge-With-Yam-Oil-Pepper-&Onions The Naija Way||The_Not_So_Famous_Secret_Formula
3 views
2 years ago
$

12 views
7 months ago
$

17 views
3 years ago
$

19 views
3 months ago
$

22 views
6 months ago
$

48 views
a year ago
$

120 views
4 years ago
$

5 views
3 years ago
$

23 views
5 months ago
$

Talent Sound Music Un Canto a la tierra – Mes Abril – Categoría: Voz – La tierra (Cover by @nancybmp
27 views
11 months ago
$

29 views
a year ago
$
4 views
2 years ago
$

40 views
a year ago
$

17 views
3 years ago
$

12 views
3 years ago
$

26 views
3 months ago
$
7 views
9 months ago
$

2 views
3 years ago
$
Comments:
Reply:
To comment on this video please connect a HIVE account to your profile: Connect HIVE Account