Spectrumecons 7 Week Challenge – Challenge 6: Buying and Selling Game (Business Version) Results
0
About :
Hi Everyone,

Welcome to the results post for Challenge 6: Buying and Selling Game (Business Version). This post contains a video of the ‘Buying and Selling Game’ Excel Model generating the demand for each good, quantities sold, and profits for each participant for this contest.
Winner determined in this video
What is the Buying and Selling Game (Business Version)?
For the benefit of those who have not entered this challenge, here is a brief explanation of how the game works.
The participants are required to buy or produce goods with an allocated budget. They are given a choice of three types of goods to buy or produce. They are required to buy or produce these goods in combinations specified in the question. The participants are required to set the prices of the goods they have bought or produced. All costs are provided in the question. However, demand for each good is not provided.
The demand for the goods are determined using an Excel Model using triangle distributions. The participants are informed of the minimum, maximum, and mode values used to determine these distributions. The Excel Model uses the calculated demand and prices entered by the participants to calculate the number of goods sold. The prices, costs, quantities bought or produced, and quantities sold are used to determine the profit for each participant.
The participant with the highest profit after selling his or her goods is the winner.
Responses to the challenge are made in the comments section of the challenge post. The account with the winning entry will receive Hive equivalent to 5 times the number of participants (e.g. if challenge has 6 participants the prize will be 30 Hive (5 × 6)). The maximum prize for this challenge is 60 Hive. In addition to the winning prize, the first 12 entries are given upvotes. In addition to the prize in Hive, the winner receives 20 points, second place 10 points, and third place 5 points; these points contribute to determining the overall challenge series winner.
The format of the required entry is explained in detail in the contest itself.
For a more detailed explanation, you can access the challenge post using the following link.

Other challenges
There are six other challenges in the series. Below are five of them.
- Challenge 1: Buying and Selling Game
- Challenge 2: Game Theory
- Challenge 3: Cost Benefit Analysis
- Challenge 4: Make Me Happy
- Challenge 5: Auction
Results of the contest
Figures 1, 2, and 3 contain the model-generated demand curves for dolls, action figures, and plush toys respectively.
Figure 1: Model Generated Demand Curve for Dolls
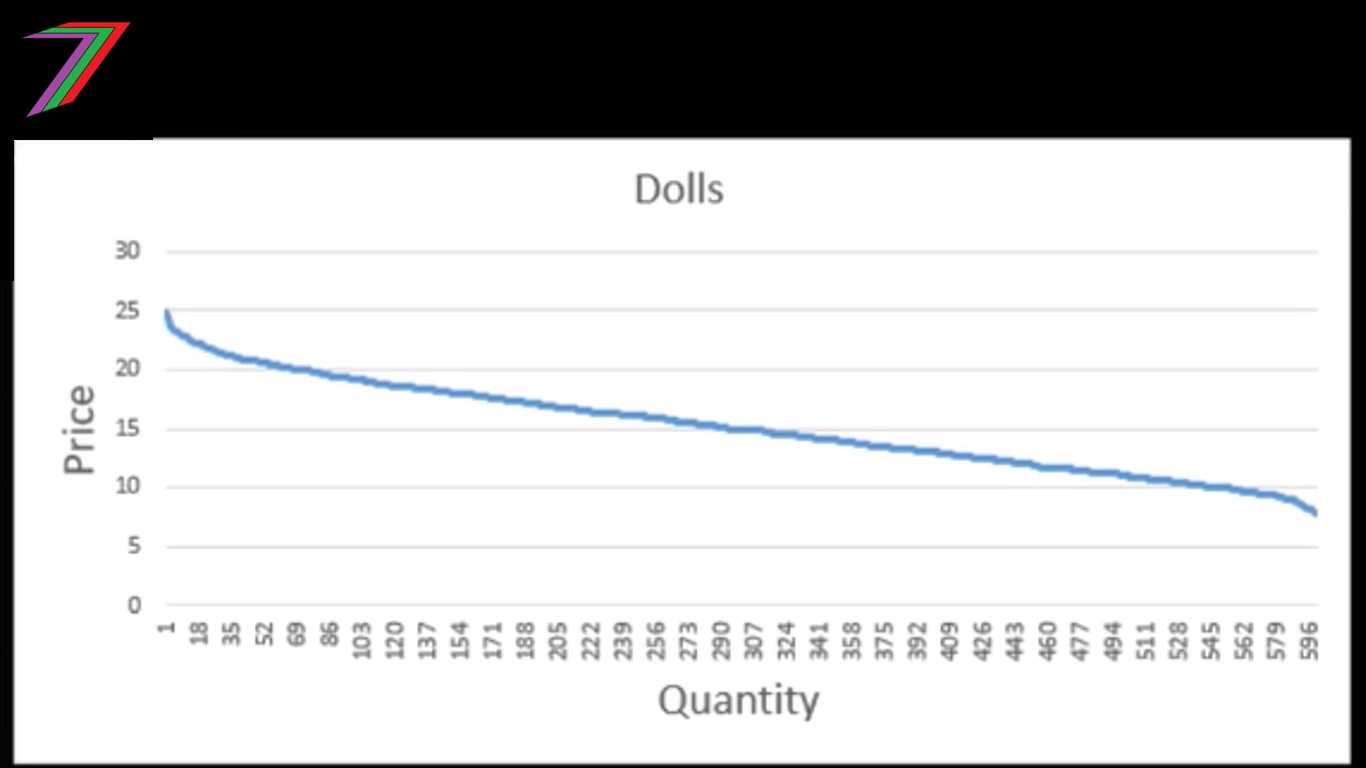
Figure 2: Model Generated Demand Curve for Action Figures
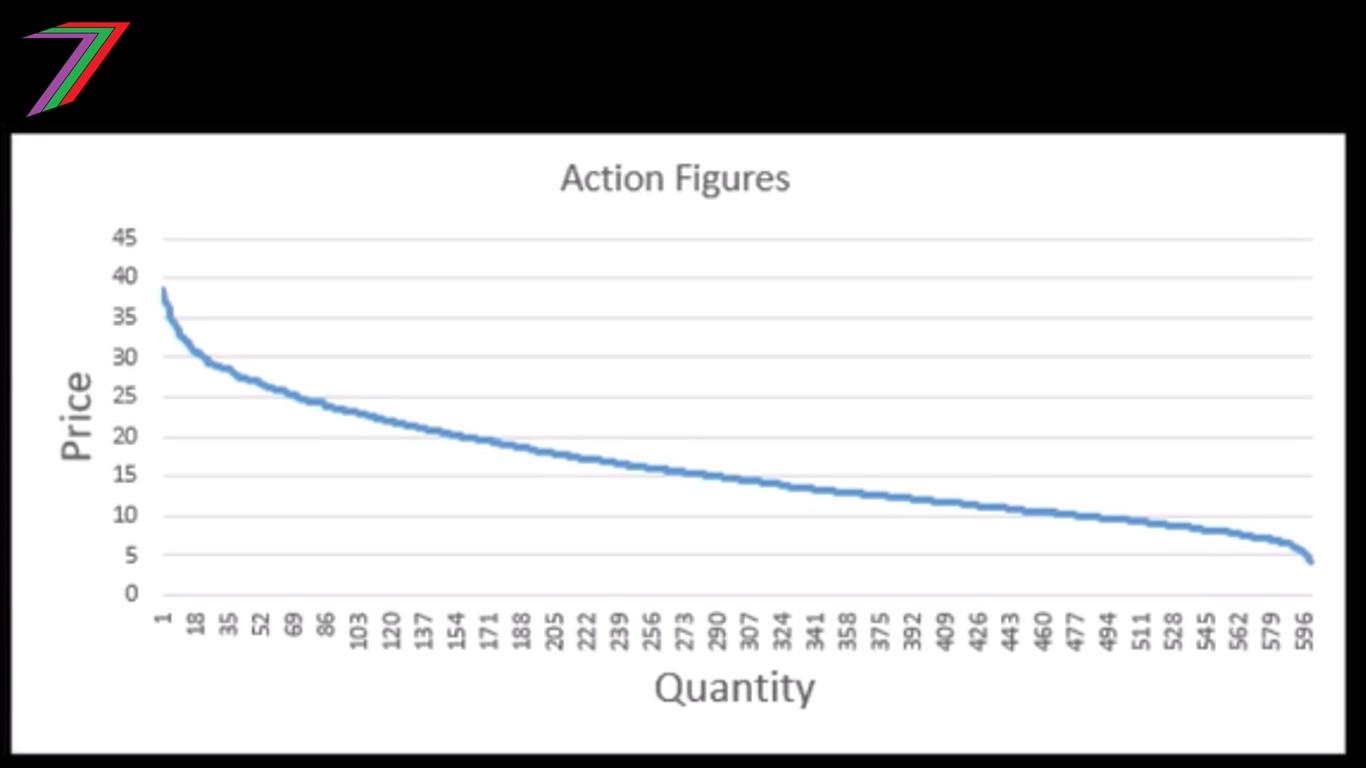
Figure 3: Model Generated Demand Curve for Plush Toys
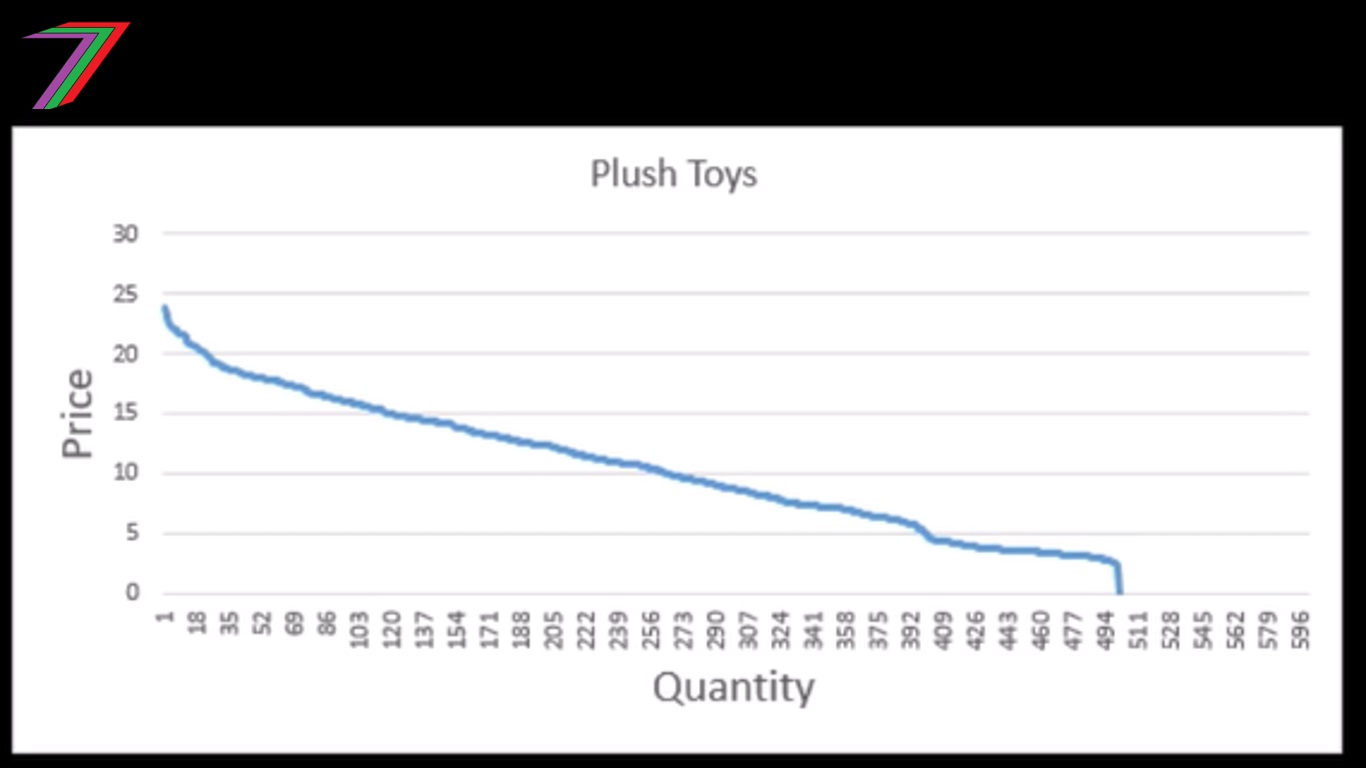
Table 1 contains responses, quantities sold, revenue, and the profit made by each participant.
Table 1: Participant responses and profit
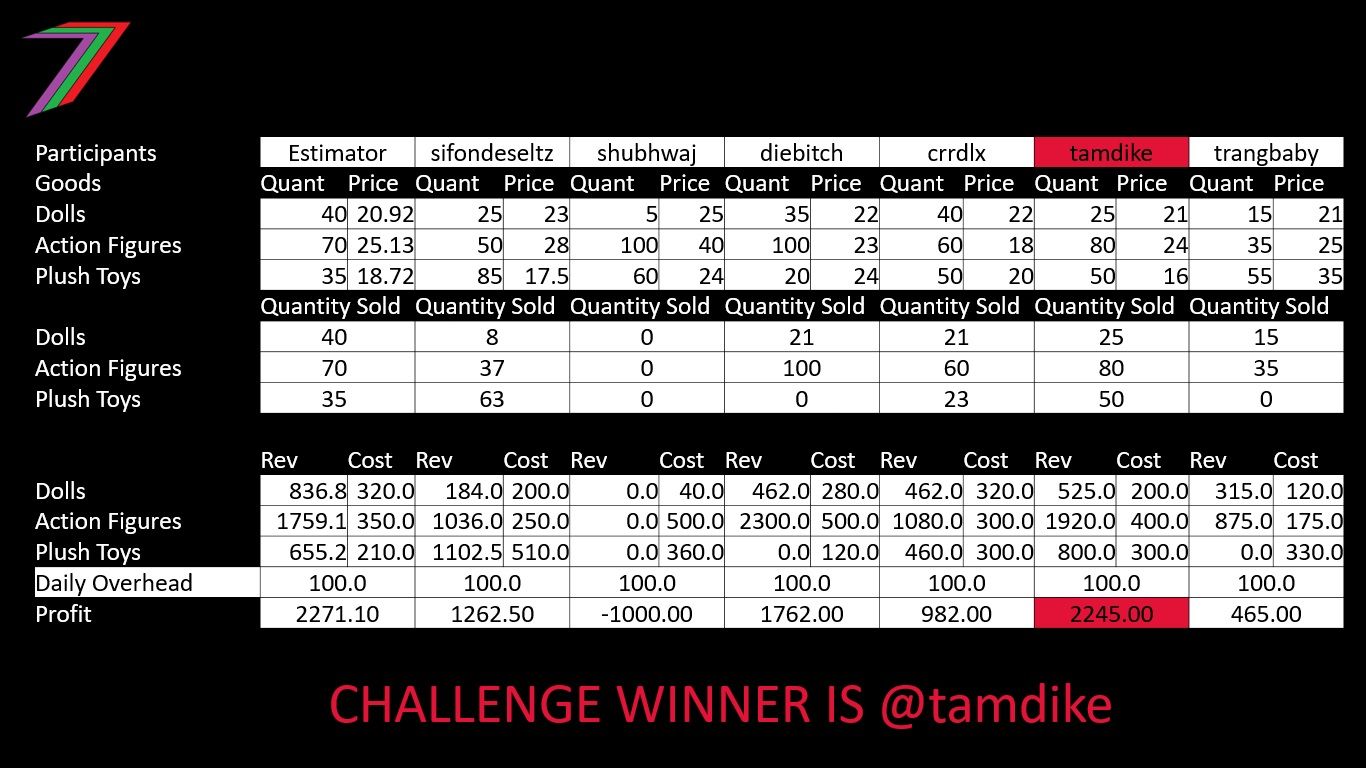
Congratulations to @tamdike for winning Challenge 6 with a profit of $2245. @tamdike wins 30 Hive for this challenge (5 × 6) and 20 points. @diebitch is awarded 10 points for second place and @trangbaby is awarded 5 points for third place. @crrdlx and @sifondeseltz’s profits were not considered as both went over the $1000 budget.
@tamdike produced 25 dolls at $8 per a doll, 80 action figures at $5 per a doughnut, and 50 plush toys at $6 per a plush toy. @tamdike priced them to sell at $21, $24, and $16 respectively. At those prices, all dolls, action figures and plush toys were sold. This generated a total revenue of $3245 ($525 for dolls, $1920 for action figures, and $800 for plush toys). The total cost of producing these toys was $1000 ($200 for dolls, $400 for action figures, $300 for plush toys, and $100 daily overhead). @tamdike's total profit was $2245.
I would also like to thank @shubhwaj for participating.
Below are the challenge series overall scores, so far.
Overall Series Score
| Participants | Points |
|---|---|
| Tamdike | 50 |
| Crrdlx | 45 |
| Diebitch | 45 |
| Shubhwaj | 30 |
| Rexplanet | 10 |
| Failingforwards | 5 |
| Trangbaby | 5 |
Challenge Tips
For the business version of the Buying and Selling Game, a participant needs to understand three areas. These areas are:
- Impact of working under a budget.
- Relationships between costs, demand and price.
- Shape of the demand curve.
The extent of the budget plays a huge role in determining what goods should be focused on.
If the budget is large, production of goods should be more widely distributed across all three available types of goods. Generally, goods with elastic demand should be favoured over goods with inelastic demand. Goods should be bought close to the point where customers’ willingness-to-pay is almost at cost. Thus, goods should not be priced too high.
If the budget is small, goods with inelastic demand and high maximum price should be favoured over goods with elastic demand and lower maximum price. Prices should be high to capture as much consumer surplus from customers with high willingness-to-pay. If the budget is really small, it might be optimal to produce just one good.
Understanding the relationships between cost, demand, and price is essential for optimal pricing of goods. Goods must be priced above cost to make profit but if the prices are too high, insufficient customers will buy the goods, which will reduce profits.
The maximum, minimum, mode, and diminishing marginal utility shape the demand curve. High diminishing marginal utility increases inelasticity of demand. A large difference between maximum and mode price, increases inelasticity of demand in the top portion of the demand curve. A large difference between minimum and mode price, increases inelasticity of demand in the bottom portion of the demand curve. The top half of the demand curve is most relevant when the budget is small. The bottom half of the demand curve is normally more relevant when the budget is large.
More posts

If you want to read any of my other posts, you can click on the links below. These links will lead you to posts containing my collection of works. These 'Collection of Works' posts have been updated to contain links to the Hive versions of my posts.


My New CBA Udemy Course
The course contains over 10 hours of video, over 60 downloadable resources, over 40 multiple-choice questions, 2 sample case studies, 1 practice CBA, life time access and a certificate on completion. The course is priced at the Tier 1 price of £20. I believe it is frequently available at half-price.
Future of Social Media

Show more
Tags :
Woo!
This creator can upvote comments using 3speak's stake today because they are a top performing creator!
Leave a quality comment relating to their content and you could receive an upvote
worth at least a dollar.
Their limit for today is $0!
Their limit for today is $0!

2 views
5 years ago
$

3 views
4 years ago
$
2 views
a year ago
$

1 views
4 years ago
$

5 views
2 years ago
$
More Videos

18 views
a year ago
$

13 views
3 years ago
$

8 views
3 years ago
$

1 views
2 years ago
$

3 views
3 years ago
$

50 views
3 years ago
$

39 views
a month ago
$

15 views
2 years ago
$

0 views
5 months ago
$

5 views
5 years ago
$

1 views
4 years ago
$

3 views
3 years ago
$

2 views
a year ago
$

10 views
4 years ago
$

8 views
3 years ago
$

13 views
2 years ago
$

13 views
2 years ago
$

3 views
3 years ago
$

0 views
9 months ago
$

1 views
5 years ago
$

9 views
a year ago
$

1 views
a month ago
$

5 views
2 years ago
$
@spectrumecons: 2.0928
@slobberchops: 1.3681
@buggedout: 0.9983
@kevinwong: 0.4296
@clixmoney: 0.3577
@josediccus: 0.3488
@lynds: 0.2141
@nainaztengra: 0.1766
@hope-on-fire: 0.1348
@slobberchops: 1.3681
@buggedout: 0.9983
@kevinwong: 0.4296
@clixmoney: 0.3577
@josediccus: 0.3488
@lynds: 0.2141
@nainaztengra: 0.1766
@hope-on-fire: 0.1348
Comments:
Reply:
To comment on this video please connect a HIVE account to your profile: Connect HIVE Account