Are The US Equity Markets Done Selling Off???
2
About :
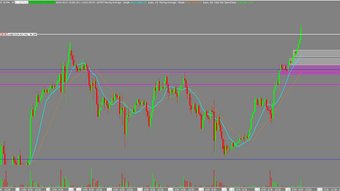
It feels like February and March all over again. COVID-19 case increasing in the US and Europe. Germany and France going into lock down mode. The equity markets selling off. Nevertheless, I posted a Nassaq futures chart in the Leo Discord channel this morning as a level to go long. By the end of the trading day on Weds. price entered the level and is now raising. In the morning, I will be looking to go long.
MY TRADING METHODOLOGY IN A NUTSHELL BELOW
I’m a supply and demand trader. The premise of supply and demand trading is when the market makes a sharp move up or down the large institutions i.e banks/hedge funds are not able to get their entire trade placed into the market, leaving pending orders to buy or sell at the zone with the expectation the market will return to the zone and the rest of their trading position will be filled.
https://finance.yahoo.com/news/stock-market-news-live-october-28-2020-221607983.html
https://finance.yahoo.com/news/jim-cramer-potential-lockdown-buying-131126552.html
I use multiple time frame (MTF) analysis to improve my discretionary trading decisions. MTF analysis involves analyzing the same asset on multiple time frames. The rule of thumb when using MFT is you want your charts to scale down/up by 4X – 6X. In my case I tend to look at:
Monthly Charts (curve time frame) – which represents that jet fighter flying over the football stadium.
Weekly Charts (trend time frame) – which represents the concession stands looking down at the field.
Daily Charts (entry time frame) – which represents being on the football field with the player.
4 Hr Charts (entry time frame) – which represents the center hiking the ball to the quarterback.
Tags :
Their limit for today is $0!


Comments:
Reply:
To comment on this video please connect a HIVE account to your profile: Connect HIVE Account