Final Hours Are Ticking For Stellar Lumens XLM To Break This Pattern
0
About :
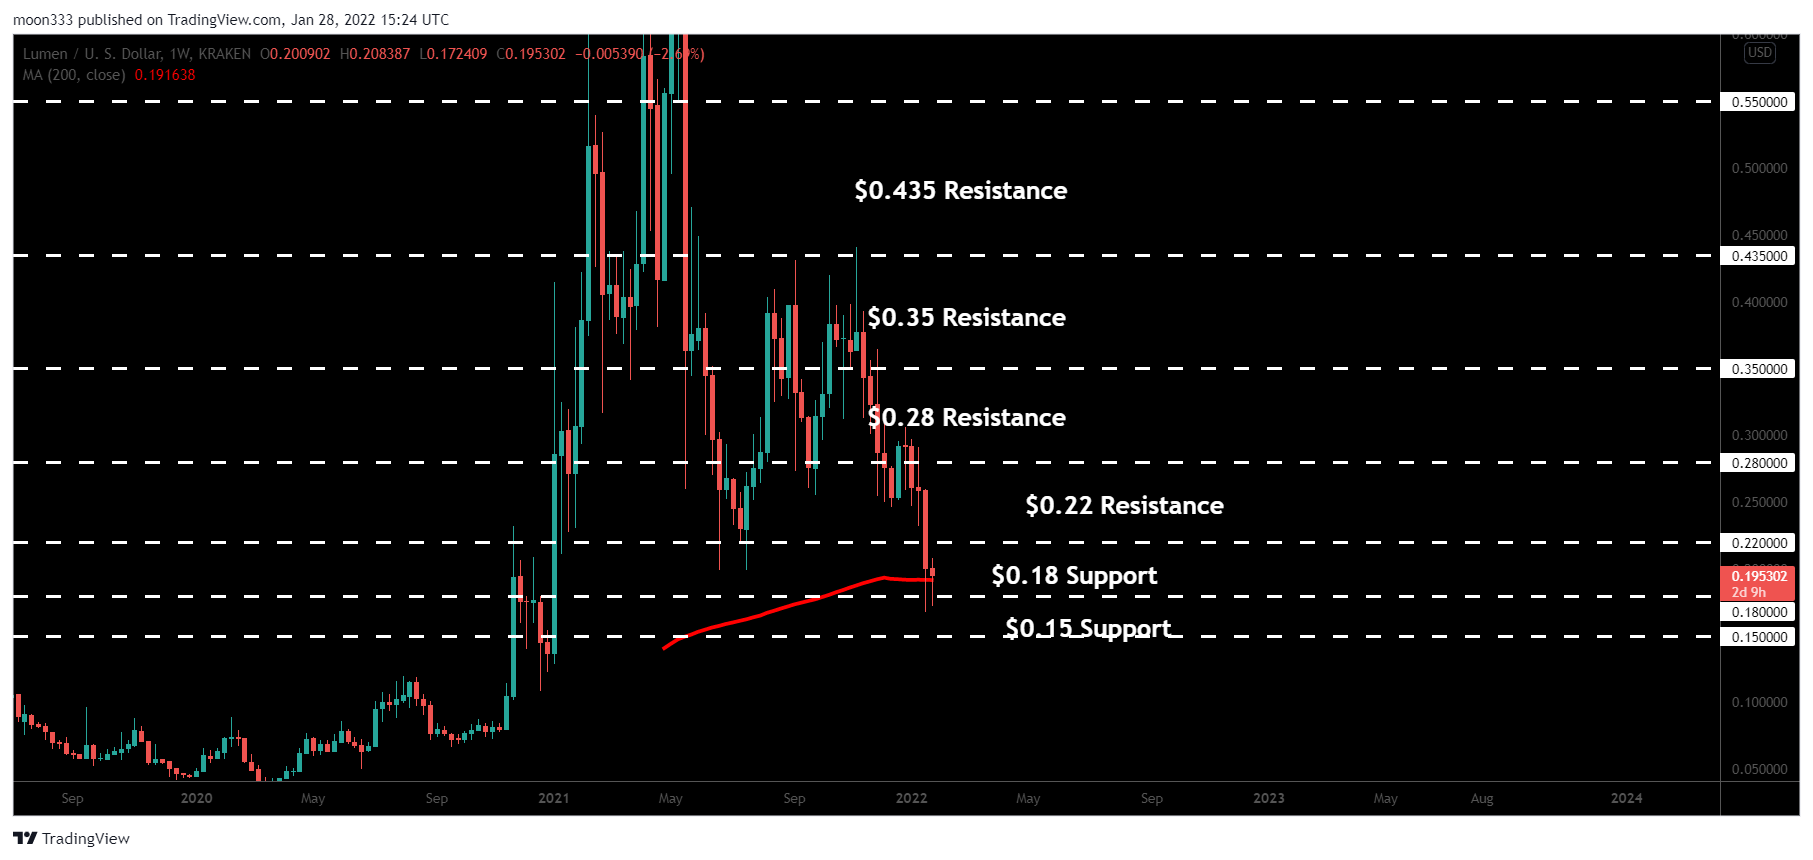
SMA and price level support:
On the weekly time frame priceline of XLM is above the 200 SMA and $0.18 support levels.
Down channel:
On a daily time frame, XLM has formed a down channel and bounced by the support. Stellar has also broken down simple moving averages with the time period of 25, 50, 100, and 200 on this daily time frame.

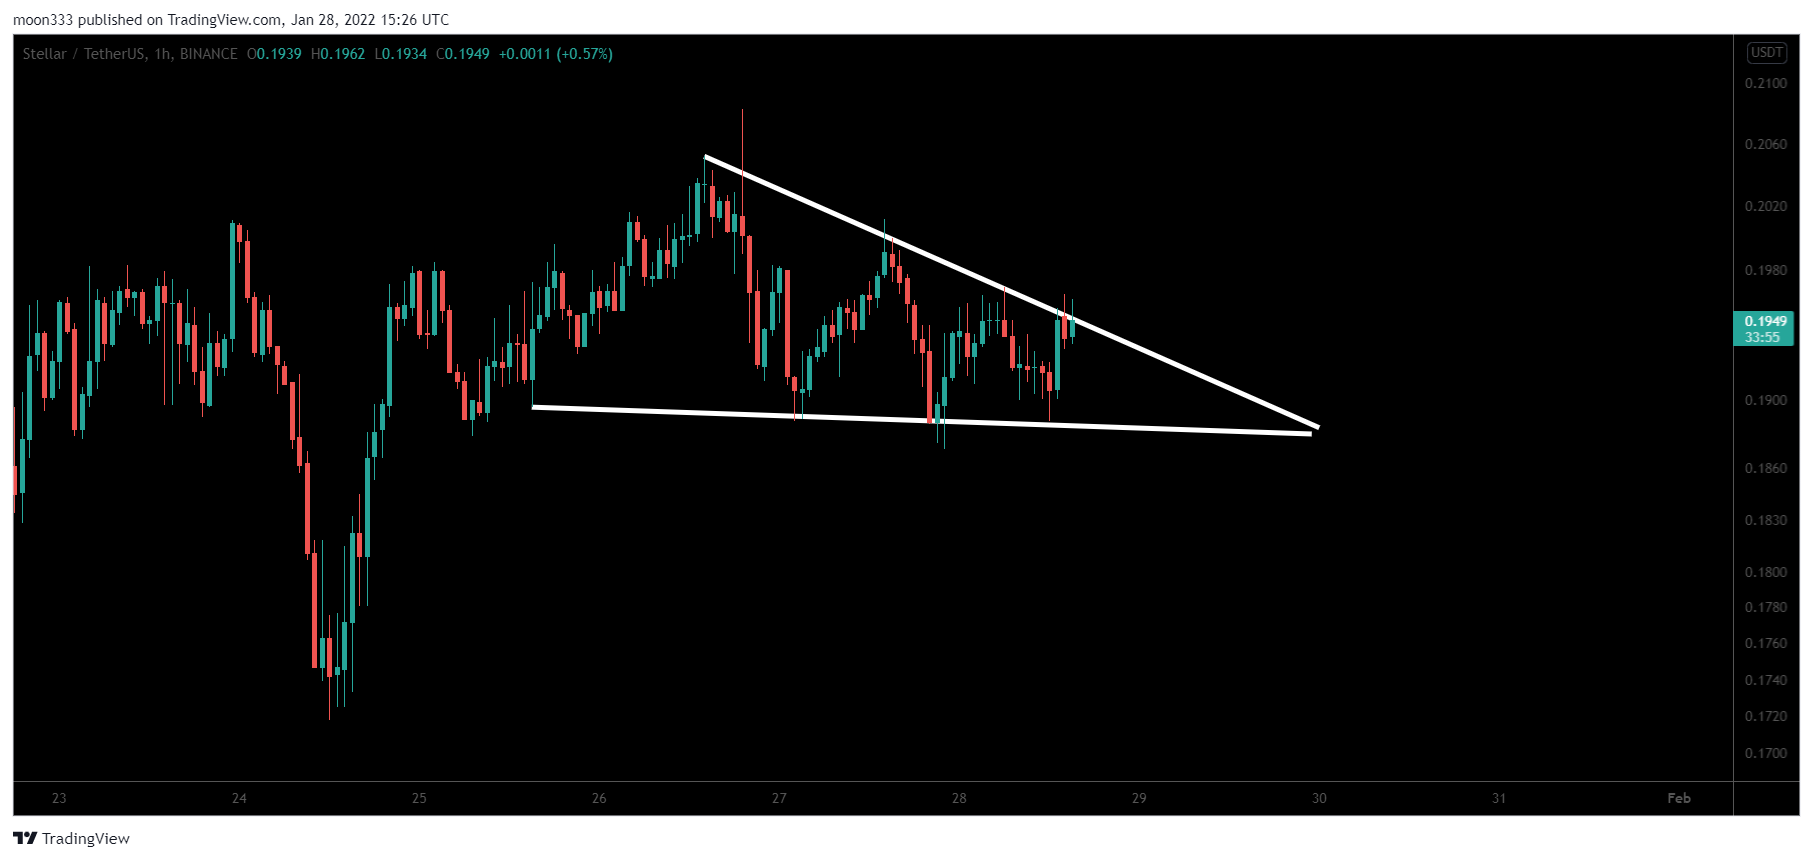
Descending triangle:
On an hourly chart, XLM has formed a descending triangle and it can break it soon. In case of breaking out the resistance it can reach the resistance of down channel on daily.
If you like the video then don't forget to upvote/tip and share, thanks
You can also support my work at Patreon for more ideas:
https://www.patreon.com/moon333
In order to play and watch the current performance of the chart you need at least a free account on tradingview:
https://www.tradingview.com/gopro/?share_your_love=moon333
KuCoin is one of the best exchange to find crypto gems:
https://www.kucoin.com/ucenter/signup?rcode=rJSDVT3
Link for Binance exchange, to trade crypto:
https://www.binance.com/?ref=11256882
Note: Above idea is for educational purpose only. It is advised to diversify and strictly follow the stop loss, and don't get stuck with trade.
Show more
Tags :
Woo!
This creator can upvote comments using 3speak's stake today because they are a top performing creator!
Leave a quality comment relating to their content and you could receive an upvote
worth at least a dollar.
Their limit for today is $0!
Their limit for today is $0!
0 views
3 years ago
$

1 views
2 years ago
$

0 views
a year ago
$

0 views
a year ago
$

1 views
2 years ago
$
More Videos

3 views
3 years ago
$

1 views
a year ago
$

4 views
10 months ago
$

37 views
10 months ago
$

9 views
2 years ago
$

2 views
2 years ago
$

67 views
a year ago
$

7 views
a year ago
$

6 views
a year ago
$

5 views
9 months ago
$

7 views
2 years ago
$

33 views
2 years ago
$

4 views
2 years ago
$

3 views
3 months ago
$

3 views
a month ago
$

1 views
4 years ago
$

5 views
4 years ago
$

4 views
a year ago
$

15 views
3 years ago
$

0 views
2 years ago
$

6 views
11 months ago
$

165 views
a year ago
$

3 views
3 years ago
$
Comments:
Reply:
To comment on this video please connect a HIVE account to your profile: Connect HIVE Account