This Time Is Really Different
14
About :
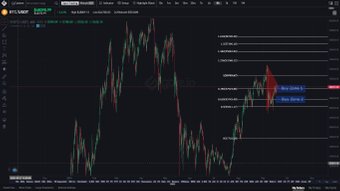
Bitcoin is now close to its all-time high of just under $20,000, which it touched at the peak of the 2017 bubble. Bitcoin is now up 80% in just the past six weeks. Investors have been flocking to cryptocurrencies during the pandemic-driven volatility on global stock markets. But it’s not the retailer that’s buying this run it, it’s the Smart Money that’s doing all the buying...this time is really different.
https://u.today/bitcoin-came-close-to-18500-with-jpmorgan-analyst-calling-it-alternative-to-gold
https://beincrypto.com/deutsche-bank-bitcoin-is-increasingly-being-favored-over-gold/
https://cryptoquant.com/overview/btc-exchange-flows
MY TRADING METHODOLOGY IN A NUTSHELL BELOW
I’m a supply and demand trader. The premise of supply and demand trading is when the market makes a sharp move up or down the large institutions i.e banks/hedge funds are not able to get their entire trade placed into the market, leaving pending orders to buy or sell at the zone with the expectation the market will return to the zone and the rest of their trading position will be filled.
I use multiple time frame (MTF) analysis to improve my discretionary trading decisions. MTF analysis involves analyzing the same asset on multiple time frames. The rule of thumb when using MFT is you want your charts to scale down/up by 4X – 6X. In my case I tend to look at:
Monthly Charts (curve time frame) – which represents that jet fighter flying over the football stadium.
Weekly Charts (trend time frame) – which represents the concession stands looking down at the field.
Daily Charts (entry time frame) – which represents being on the football field with the player.
4 Hr Charts (entry time frame) – which represents the center hiking the ball to the quarterback.
Show more
Tags :
Woo!
This creator can upvote comments using 3speak's stake today because they are a top performing creator!
Leave a quality comment relating to their content and you could receive an upvote
worth at least a dollar.
Their limit for today is $0!
Their limit for today is $0!

5 views
2 years ago
$

2 views
3 years ago
$

2 views
3 years ago
$

1 views
2 years ago
$

3 views
3 years ago
$
More Videos

2 views
a year ago
$

14 views
a year ago
$

7 views
2 years ago
$

26 views
a year ago
$

4 views
3 months ago
$

1 views
2 years ago
$

5 views
7 months ago
$

3 views
3 years ago
$

3 views
a year ago
$

0 views
4 years ago
$

0 views
2 years ago
$

7 views
2 years ago
$

26 views
2 years ago
$

10 views
7 months ago
$

20 views
a year ago
$

13 views
a year ago
$
6 views
2 years ago
$
8 views
2 years ago
$

2 views
9 months ago
$

9 views
a year ago
$

3 views
3 years ago
$

3 views
2 years ago
$

1 views
3 years ago
$

4 views
2 years ago
$
Comments:
Reply:
To comment on this video please connect a HIVE account to your profile: Connect HIVE Account